https://developers.google.com/machine-learning/practica/image-classification/
Learn how Google developed the state-of-the-art image classification
model powering search in Google Photos. Get a crash course on convolutional neural
networks, and then build your own image classifier to distinguish cat photos
from dog photos.
Wednesday, May 30, 2018
AI winter is well on its way
https://blog.piekniewski.info/2018/05/28/ai-winter-is-well-on-its-way/
Deep learning has been at the forefront of the so called AI revolution for quite a few years now, and many people had believed that it is the silver bullet that will take us to the world of wonders of technological singularity (general AI). Many bets were made in 2014, 2015 and 2016 when still new boundaries were pushed, such as the Alpha Go etc. Companies such as Tesla were announcing through the mouths of their CEO's that fully self driving car was very close, to the point that Tesla even started selling that option to customers [to be enabled by future software update].
We have now mid 2018 and things have changed. Not on the surface yet, NIPS conference is still oversold, the corporate PR still has AI all over its press releases, Elon Musk still keeps promising self driving cars and Google CEO keeps repeating Andrew Ng's slogan that AI is bigger than electricity. But this narrative begins to crack. And as I predicted in my older post, the place where the cracks are most visible is autonomous driving - an actual application of the technology in the real world.
2013 - 0.413 tweets per day
2014 - 0.605 tweets per day
2015 - 0.320 tweets per day
2016 - 0.802 tweets per day
2017 - 0.668 tweets per day
2018 - 0.263 tweets per day (until 24 May)
Deep learning has been at the forefront of the so called AI revolution for quite a few years now, and many people had believed that it is the silver bullet that will take us to the world of wonders of technological singularity (general AI). Many bets were made in 2014, 2015 and 2016 when still new boundaries were pushed, such as the Alpha Go etc. Companies such as Tesla were announcing through the mouths of their CEO's that fully self driving car was very close, to the point that Tesla even started selling that option to customers [to be enabled by future software update].
We have now mid 2018 and things have changed. Not on the surface yet, NIPS conference is still oversold, the corporate PR still has AI all over its press releases, Elon Musk still keeps promising self driving cars and Google CEO keeps repeating Andrew Ng's slogan that AI is bigger than electricity. But this narrative begins to crack. And as I predicted in my older post, the place where the cracks are most visible is autonomous driving - an actual application of the technology in the real world.
The dust settled on deep learning
When the ImageNet has been effectively solved (note this does not mean that vision is solved), many prominent researchers in the field (including even typically quiet Geoff Hinton) were actively giving press interviews, publicizing stuff on social media (e.g. Yann Lecun, Andrew Ng, Fei Fei Lee to name a few). The general tone was that we are in front of a gigantic revolution and from now on things can only accelerate. Well years have passed and the twitter feeds of those people became less active, as exemplified by Andrew Ng below:2013 - 0.413 tweets per day
2014 - 0.605 tweets per day
2015 - 0.320 tweets per day
2016 - 0.802 tweets per day
2017 - 0.668 tweets per day
2018 - 0.263 tweets per day (until 24 May)
Predictive algorithms are infiltrating schools — here’s why that’s a good thing
https://thenextweb.com/contributors/2018/05/27/predictive-algorithms-are-infiltrating-schools-heres-why-thats-a-good-thing/+
A few weeks ago a story broke revealing that the New Orleans Police Department had been using a predictive policing tool supplied by CIA-backed data mining company, Palantir, to identify gang members. The software identified ties between gang members and non-gang members, analyzed criminal histories, crawled social media, and finally, predicted the likelihood that individuals would commit violence. Predictably, outrage ensued. But this use of predictive analytics to identify risk is hardly new: it’s been used in numerous US cities, in counterintelligence operations, and — here’s the twist — in schools.
‘Risk identification’ has become a highly in-vogue term in the American public school system. Districts want to decrease dropout rates, and a slew of data-driven tools have cropped up that use predictive analytics derived from questionably acquired data in order to identify at-risk students. Preventing drop out, like preventing crime, is a noble and worthy goal. But the reason that predictive policing has inspired outrage, is that algorithms tend to perpetuate systemic bias, and only work through collecting swaths of data points — data that people may not know is being collected.
The rise of predictive analytics in institutions such as schools and criminal justice systems raises a series of ethical questions which I’ve outlined below. But the fact is these algorithms are here to stay — and, I argue, that’s a good thing. The questions they raise — about racism, data ownership, and the ethics of predicting crime at all — are ones we should have been examining for decades.
It’s not illegal for schools to collect data — from grades, to test scores, to internet searches, to behavioral notes — but many parents are extremely uncomfortable with the idea of not being informed about precisely what data is being collected, and more importantly, how it’s being used. In fact, in 2012 parents found out that inBloom, a $100M corporation, was collecting and sharing student data with vendors and other third parties. Mass outrage ensued, and every single state and district responded by pulling out of inBloom contracts, resulting in the closure of the company in 2014.
Since then, though, companies such as Hoonuit and Microsoft have quietly stepped in to serve school districts looking to decrease dropout rate. In fact, the federal government has actually mandated that every state collect student data from preschool onwards in a longitudinal data system. The data in this repository includes medical information, survey responses, child services, the criminal justice system, and health departments. Under the Family Educational Rights and Privacy Act (FERPA) medical and counseling records included in education records are not protected by HIPAA, meaning that sensitive mental and physical information can be shared with third parties without parental consent.
This same logic applies to schools: ingrained racism and other forms of prejudice cause teachers (who are not infallible) to report certain behaviors for one kid more than those same behaviors for another. This teaches the algorithm to mimic those same biases, thus perpetuating systemic bias.
If you misidentify a student as ‘at risk’ and try and help them, it’s hard to imagine this backfiring in the same way that tracking potential criminals could. The worst case scenario is a child feeling upset at being placed in an intervention program when it’s not necessarily needed.
Predictive analytics does reduce people to a set of data points. But we humans do the same, we just also tend to give more weight to the wrong data points — such as appearance and background. This system is ugly — but in lieu of a wholly different structure, the transparency offered by predictive analytics is desirable. If the algorithm is racist, we can fix that much more easily than we can fix a racist person.
The real drawback of using analytics is data privacy — an issue that is at the heart of national debates occurring today. When you’re dealing with children’s data, it’s important to know how districts are using and distributing the data they’re collecting — particularly when they don’t use a proprietary system (we’ve all seen what can happen with third party data breaches!).
There will be data breaches, and there will be companies that illegally steal information from predictive analytics systems. But the cost of making data-driven decisions is outweighed by the benefits of being able to examine, in qualitative ways, how we make predictions about human behavior.
A few weeks ago a story broke revealing that the New Orleans Police Department had been using a predictive policing tool supplied by CIA-backed data mining company, Palantir, to identify gang members. The software identified ties between gang members and non-gang members, analyzed criminal histories, crawled social media, and finally, predicted the likelihood that individuals would commit violence. Predictably, outrage ensued. But this use of predictive analytics to identify risk is hardly new: it’s been used in numerous US cities, in counterintelligence operations, and — here’s the twist — in schools.
‘Risk identification’ has become a highly in-vogue term in the American public school system. Districts want to decrease dropout rates, and a slew of data-driven tools have cropped up that use predictive analytics derived from questionably acquired data in order to identify at-risk students. Preventing drop out, like preventing crime, is a noble and worthy goal. But the reason that predictive policing has inspired outrage, is that algorithms tend to perpetuate systemic bias, and only work through collecting swaths of data points — data that people may not know is being collected.
The rise of predictive analytics in institutions such as schools and criminal justice systems raises a series of ethical questions which I’ve outlined below. But the fact is these algorithms are here to stay — and, I argue, that’s a good thing. The questions they raise — about racism, data ownership, and the ethics of predicting crime at all — are ones we should have been examining for decades.
1. Who owns a minor’s data?
During a 2015 congressional hearing on how emerging technologies affect student privacy, a representative asked for a summary of how much data is collected on students by the time they reach graduate school. Joel Reidenberg, director of the Center on Law & Information Policy at Fordham Law School, quickly answered, “Just think George Orwell, and take it to the nth degree.”It’s not illegal for schools to collect data — from grades, to test scores, to internet searches, to behavioral notes — but many parents are extremely uncomfortable with the idea of not being informed about precisely what data is being collected, and more importantly, how it’s being used. In fact, in 2012 parents found out that inBloom, a $100M corporation, was collecting and sharing student data with vendors and other third parties. Mass outrage ensued, and every single state and district responded by pulling out of inBloom contracts, resulting in the closure of the company in 2014.
Since then, though, companies such as Hoonuit and Microsoft have quietly stepped in to serve school districts looking to decrease dropout rate. In fact, the federal government has actually mandated that every state collect student data from preschool onwards in a longitudinal data system. The data in this repository includes medical information, survey responses, child services, the criminal justice system, and health departments. Under the Family Educational Rights and Privacy Act (FERPA) medical and counseling records included in education records are not protected by HIPAA, meaning that sensitive mental and physical information can be shared with third parties without parental consent.
2. Does the algorithm’s ingrained systemic bias help or harm at-risk students?
Algorithms predict future behavior based on precedent. But when precedent shows higher percentages of at-risk behavior by minorities, the algorithm then predicts that minorities are more at risk than non minorities. This is not, however, necessarily an accurate reading. A recent study found that not every crime committed has an equal chance of being recorded by police — for example, crimes in areas that are heavily patrolled are more likely to be reported than crimes in (high income) neighborhoods with little patrol.This same logic applies to schools: ingrained racism and other forms of prejudice cause teachers (who are not infallible) to report certain behaviors for one kid more than those same behaviors for another. This teaches the algorithm to mimic those same biases, thus perpetuating systemic bias.
3. Is it ethical to intervene based on data-driven predictions?
This is the question at the heart of the controversy over police using predictive analytics. The idea of predicting crime before it’s ever happened is decidedly dystopian — after all, at what point does a crime become a crime? That said, intervening to help students succeed is a much more noble goal than punishing a future criminal.If you misidentify a student as ‘at risk’ and try and help them, it’s hard to imagine this backfiring in the same way that tracking potential criminals could. The worst case scenario is a child feeling upset at being placed in an intervention program when it’s not necessarily needed.
Predictive analytics is not the beast we think it is
The reality is that all prevention and punishment systems have always been predictive. The parole system, for instance, is essentially a qualitative assessment of whether or not a person is likely to commit a crime again (a predictive assessment). Similarly, intervention systems in schools have identified “at-risk” students through profiling for decades — a system rife with bias. Predictive analytics just renders these already existing systems more transparent. And people are upset because they’re finally viewing the ugliness that is and has always been predictive justice.Predictive analytics does reduce people to a set of data points. But we humans do the same, we just also tend to give more weight to the wrong data points — such as appearance and background. This system is ugly — but in lieu of a wholly different structure, the transparency offered by predictive analytics is desirable. If the algorithm is racist, we can fix that much more easily than we can fix a racist person.
The real drawback of using analytics is data privacy — an issue that is at the heart of national debates occurring today. When you’re dealing with children’s data, it’s important to know how districts are using and distributing the data they’re collecting — particularly when they don’t use a proprietary system (we’ve all seen what can happen with third party data breaches!).
There will be data breaches, and there will be companies that illegally steal information from predictive analytics systems. But the cost of making data-driven decisions is outweighed by the benefits of being able to examine, in qualitative ways, how we make predictions about human behavior.
Tuesday, May 29, 2018
NLP Architect by Intel® AI Lab
http://nlp_architect.nervanasys.com/index.html
NLP Architect is an open-source Python library for exploring the state-of-the-art deep learning topologies and techniques for natural language processing and natural language understanding. It is intended to be a platform for future research and collaboration.
The library includes our past and ongoing NLP research and development efforts as part of Intel AI Lab.
NLP Architect can be downloaded from Github: https://github.com/NervanaSystems/nlp-architect
Overtime the list of models included in this space will change, though all generally run with Python 3.5+
NLP Architect by Intel® AI Lab
Release: 0.1
Date: May 17, 2018
NLP Architect is an open-source Python library for exploring the state-of-the-art deep learning topologies and techniques for natural language processing and natural language understanding. It is intended to be a platform for future research and collaboration.
The library includes our past and ongoing NLP research and development efforts as part of Intel AI Lab.
NLP Architect can be downloaded from Github: https://github.com/NervanaSystems/nlp-architect
How can NLP Architect be used
- Train models using provided algorithms, reference datasets and configurations
- Train models using your own data
- Create new/extend models based on existing models or topologies
- Explore how deep learning models tackle various NLP tasks
- Experiment and optimize state-of-the-art deep learning algorithms
- integrate modules and utilities from the library to solutions
Library Overview
Research driven NLP/NLU models
The library contains state-of-art and novel NLP and NLU models in a varity of topics:- Dependency parsing
- Intent detection and Slot tagging model for Intent based applications
- Memory Networks for goal-oriented dialog
- Key-value Network for question&answer system
- Noun phrase embedding vectors model
- Noun phrase semantic segmentation
- NER and NE expansion
- Text chunking
- Reading comprehension
Deep Learning frameworks
Because of the current research nature of the library, several open source deep learning frameworks are used in this repository including:Overtime the list of models included in this space will change, though all generally run with Python 3.5+
Using the Models
Each of the models includes a comprehensive description on algorithms, network topologies, reference dataset descriptions and loader, and evaluation results. Overtime the list of models included in this space will grow.Contributing to the library
We welcome collaboration, suggestions, and critiques. For information on how to become a developer on this project, please see the developer guide.Sunday, May 27, 2018
Welcome to the Elements of artificial intelligence free online course
https://www.elementsofai.com/
- Do you wonder what AI really means?
- Are you thinking about the kind of impact AI might have on your job or life?
- Do you want to understand how AI will develop and affect us in the coming years?
Which machine learning algorithm should I use? 8
https://blogs.sas.com/content/subconsciousmusings/2017/04/12/machine-learning-algorithm-use
This resource is designed primarily for beginner to intermediate data scientists or analysts who are interested in identifying and applying machine learning algorithms to address the problems of their interest.
A typical question asked by a beginner, when facing a wide variety of machine learning algorithms, is “which algorithm should I use?” The answer to the question varies depending on many factors, including:
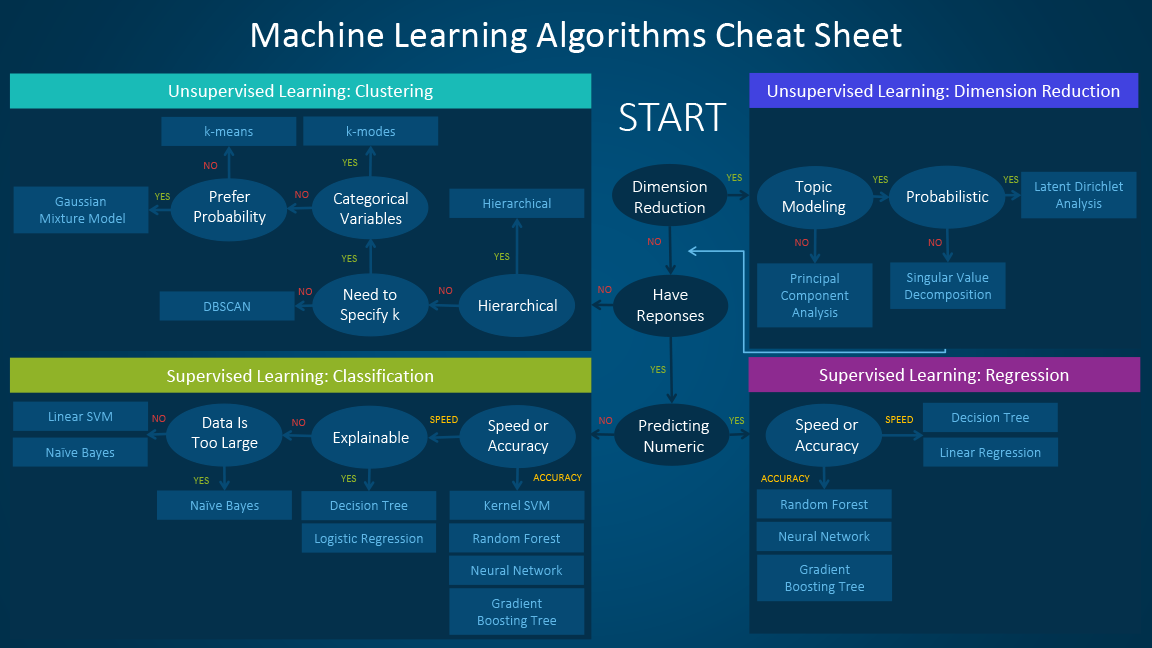
The machine learning algorithm cheat sheet helps you to choose from a variety of machine learning algorithms to find the appropriate algorithm for your specific problems. This article walks you through the process of how to use the sheet.
Since the cheat sheet is designed for beginner data scientists and analysts, we will make some simplified assumptions when talking about the algorithms.
The algorithms recommended here result from compiled feedback and tips from several data scientists and machine learning experts and developers. There are several issues on which we have not reached an agreement and for these issues we try to highlight the commonality and reconcile the difference.
Additional algorithms will be added in later as our library grows to encompass a more complete set of available methods.
When presented with a dataset, the first thing to consider is how to obtain results, no matter what those results might look like. Beginners tend to choose algorithms that are easy to implement and can obtain results quickly. This works fine, as long as it is just the first step in the process. Once you obtain some results and become familiar with the data, you may spend more time using more sophisticated algorithms to strengthen your understanding of the data, hence further improving the results.
Even in this stage, the best algorithms might not be the methods that have achieved the highest reported accuracy, as an algorithm usually requires careful tuning and extensive training to obtain its best achievable performance.
Linear regression is an approach for modeling the relationship between a continuous dependent variable y
and one or more predictorsX . The relationship between y and X can be linearly modeled as y=βTX+ϵ Given the training examples {xi,yi}Ni=1 , the parameter vector β can be learnt.
If the dependent variable is not continuous but categorical, linear regression can be transformed to logistic regression using a logit link function. Logistic regression is a simple, fast yet powerful classification algorithm. Here we discuss the binary case where the dependent variabley
only takes binary values{yi∈(−1,1)}Ni=1 (it which can be easily extended to multi-class classification problems).
In logistic regression we use a different hypothesis class to try to predict the probability that a given example belongs to the "1" class versus the probability that it belongs to the "-1" class. Specifically, we will try to learn a function of the form:p(yi=1|xi)=σ(βTxi)
andp(yi=−1|xi)=1−σ(βTxi) . Here σ(x)=11+exp(−x) is a sigmoid function. Given the training examples{xi,yi}Ni=1 , the parameter vector β can be learnt by maximizing the log-likelihood of β given the data set.
w
and biasb
of the hyperplane. This hyperplane (boundary) separates different
classes by as wide a margin as possible. The problem can be converted
into a constrained optimization problem:
minimizewsubject to||w||yi(wTXi−b)≥1,i=1,…,n.
A support vector machine (SVM) training algorithm finds the
classifier represented by the normal vector and bias of the
hyperplane. This hyperplane (boundary) separates different classes by as
wide a margin as possible. The problem can be converted into a
constrained optimization problem:
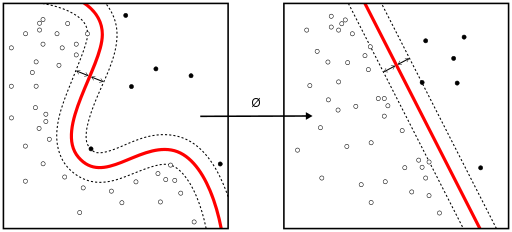 When the classes are not linearly separable, a kernel trick can be
used to map a non-linearly separable space into a higher dimension
linearly separable space.
When the classes are not linearly separable, a kernel trick can be
used to map a non-linearly separable space into a higher dimension
linearly separable space.
When most dependent variables are numeric, logistic regression and SVM should be the first try for classification. These models are easy to implement, their parameters easy to tune, and the performances are also pretty good. So these models are appropriate for beginners.
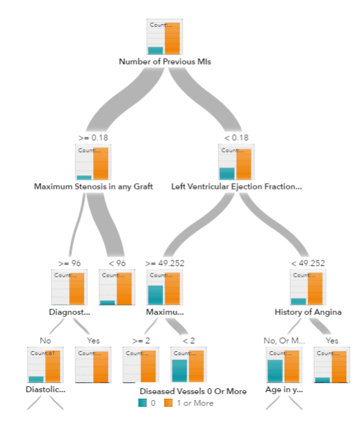 Decision trees, random forest and gradient boosting are all
algorithms based on decision trees. There are many variants of decision
trees, but they all do the same thing – subdivide the feature space
into regions with mostly the same label. Decision trees are easy to
understand and implement. However, they tend to over fit data when we
exhaust the branches and go very deep with the trees. Random Forrest and
gradient boosting are two popular ways to use tree algorithms to
achieve good accuracy as well as overcoming the over-fitting problem.
Decision trees, random forest and gradient boosting are all
algorithms based on decision trees. There are many variants of decision
trees, but they all do the same thing – subdivide the feature space
into regions with mostly the same label. Decision trees are easy to
understand and implement. However, they tend to over fit data when we
exhaust the branches and go very deep with the trees. Random Forrest and
gradient boosting are two popular ways to use tree algorithms to
achieve good accuracy as well as overcoming the over-fitting problem.
 Neural networks flourished in the mid-1980s due to their parallel and
distributed processing ability. But research in this field was impeded
by the ineffectiveness of the back-propagation training algorithm that
is widely used to optimize the parameters of neural networks. Support
vector machines (SVM) and other simpler models, which can be easily
trained by solving convex optimization problems, gradually replaced
neural networks in machine learning.
Neural networks flourished in the mid-1980s due to their parallel and
distributed processing ability. But research in this field was impeded
by the ineffectiveness of the back-propagation training algorithm that
is widely used to optimize the parameters of neural networks. Support
vector machines (SVM) and other simpler models, which can be easily
trained by solving convex optimization problems, gradually replaced
neural networks in machine learning.
In recent years, new and improved training techniques such as unsupervised pre-training and layer-wise greedy training have led to a resurgence of interest in neural networks. Increasingly powerful computational capabilities, such as graphical processing unit (GPU) and massively parallel processing (MPP), have also spurred the revived adoption of neural networks. The resurgent research in neural networks has given rise to the invention of models with thousands of layers.
 In other words, shallow neural networks have evolved into deep learning
neural networks. Deep neural networks have been very successful for
supervised learning. When used for speech and image recognition, deep
learning performs as well as, or even better than, humans. Applied to
unsupervised learning tasks, such as feature extraction, deep learning also extracts features from raw images or speech with much less human intervention.
In other words, shallow neural networks have evolved into deep learning
neural networks. Deep neural networks have been very successful for
supervised learning. When used for speech and image recognition, deep
learning performs as well as, or even better than, humans. Applied to
unsupervised learning tasks, such as feature extraction, deep learning also extracts features from raw images or speech with much less human intervention.
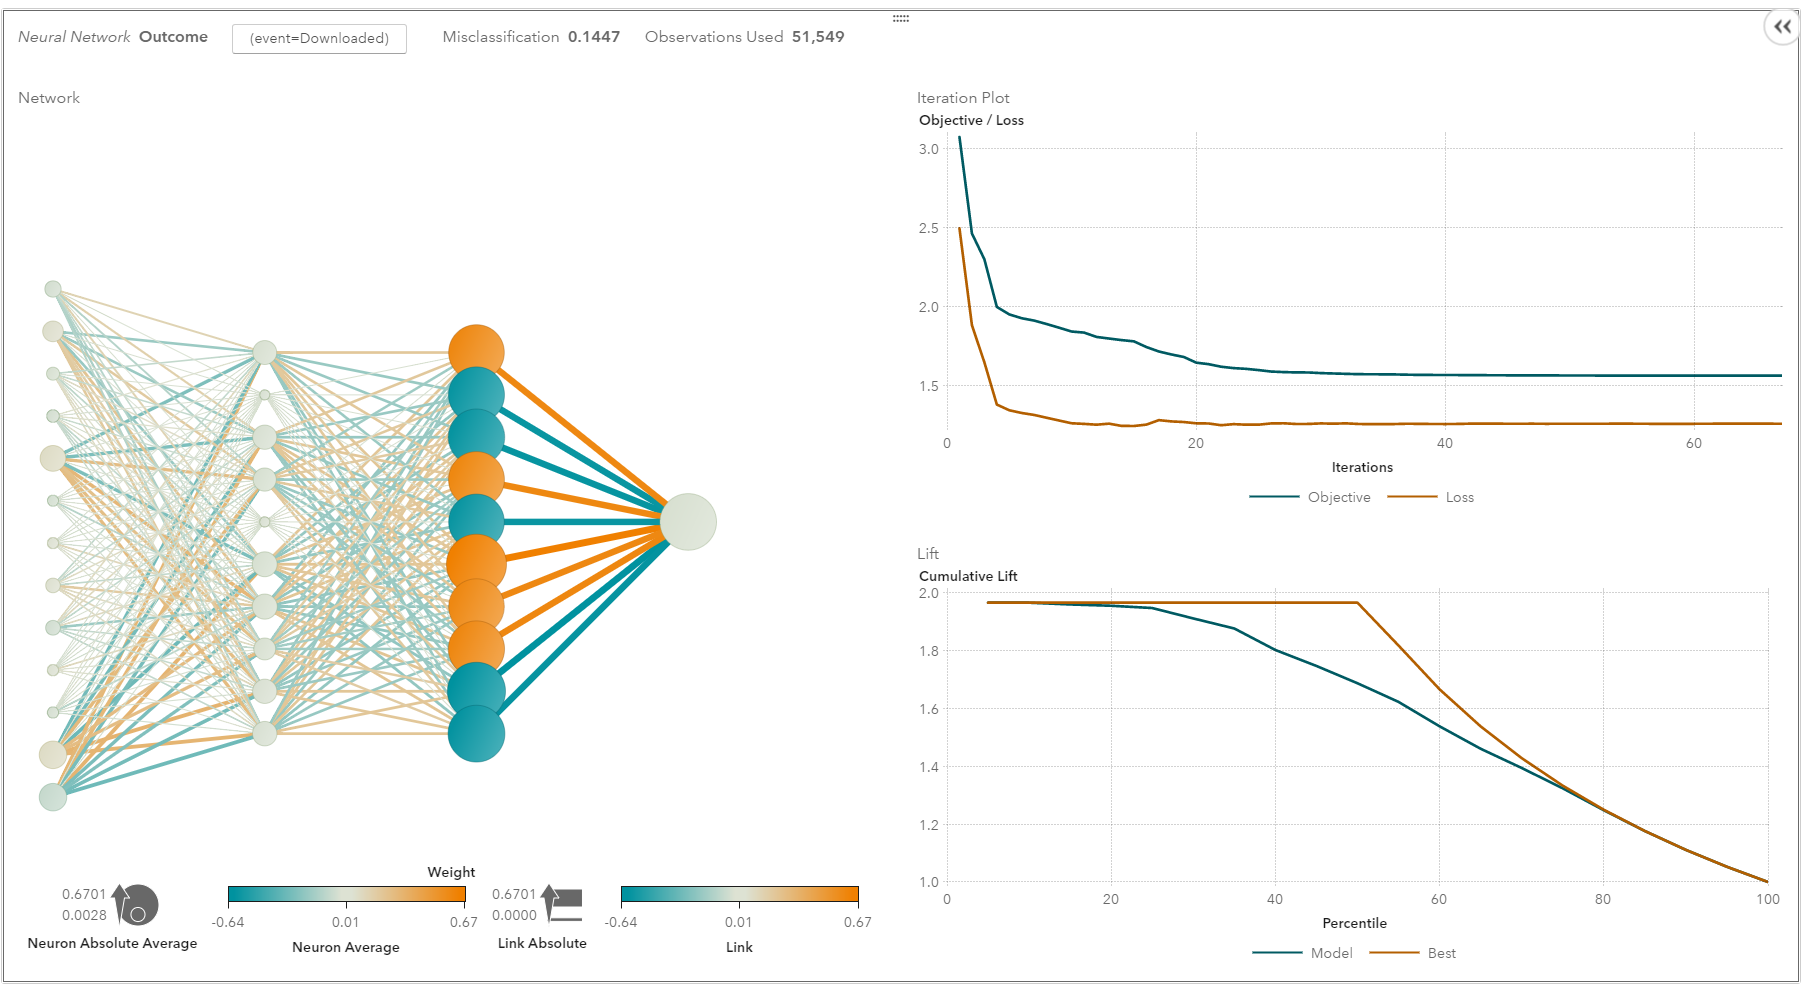
A neural network consists of three parts: input layer, hidden layers and output layer. The training samples define the input and output layers. When the output layer is a categorical variable, then the neural network is a way to address classification problems. When the output layer is a continuous variable, then the network can be used to do regression. When the output layer is the same as the input layer, the network can be used to extract intrinsic features. The number of hidden layers defines the model complexity and modeling capacity.
Deep Learning: What it is and why it matters
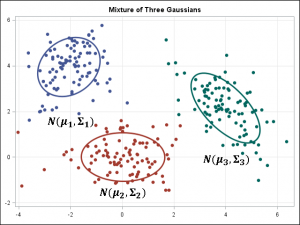
Kmeans/k-modes, GMM clustering aims to partition n observations into k
clusters. K-means define hard assignment: the samples are to be and
only to be associated to one cluster. GMM, however define a soft
assignment for each sample. Each sample has a probability to be
associated with each cluster. Both algorithms are simple and fast enough
for clustering when the number of clusters k is given.
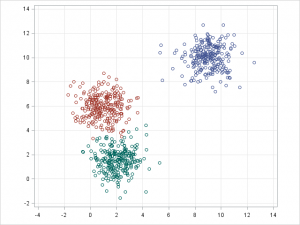
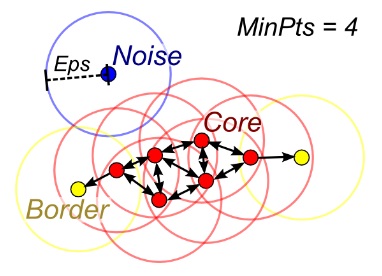 When the number of clusters k is not given, DBSCAN (density-based
spatial clustering) can be used by connecting samples through density
diffusion.
When the number of clusters k is not given, DBSCAN (density-based
spatial clustering) can be used by connecting samples through density
diffusion.
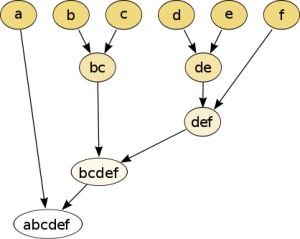
Hierarchical partitions can be visualized using a tree structure (a dendrogram). It does not need the number of clusters as an input and the partitions can be viewed at different levels of granularities (i.e., can refine/coarsen clusters) using different K.
PCA is an unsupervised clustering method which maps the original data space into a lower dimensional space while preserving as much information as possible. The PCA basically finds a subspace that most preserves the data variance, with the subspace defined by the dominant eigenvectors of the data’s covariance matrix.
The SVD is related to PCA in the sense that SVD of the centered data matrix (features versus samples) provides the dominant left singular vectors that define the same subspace as found by PCA. However, SVD is a more versatile technique as it can also do things that PCA may not do. For example, the SVD of a user-versus-movie matrix is able to extract the user profiles and movie profiles which can be used in a recommendation system. In addition, SVD is also widely used as a topic modeling tool, known as latent semantic analysis, in natural language processing (NLP).
A related technique in NLP is latent Dirichlet allocation (LDA). LDA is probabilistic topic model and it decomposes documents into topics in a similar way as a Gaussian mixture model (GMM) decomposes continuous data into Gaussian densities. Differently from the GMM, an LDA models discrete data (words in documents) and it constrains that the topics are a priori distributed according to a Dirichlet distribution.
This resource is designed primarily for beginner to intermediate data scientists or analysts who are interested in identifying and applying machine learning algorithms to address the problems of their interest.
A typical question asked by a beginner, when facing a wide variety of machine learning algorithms, is “which algorithm should I use?” The answer to the question varies depending on many factors, including:
- The size, quality, and nature of data.
- The available computational time.
- The urgency of the task.
- What you want to do with the data.
The machine learning algorithm cheat sheet
The machine learning algorithm cheat sheet helps you to choose from a variety of machine learning algorithms to find the appropriate algorithm for your specific problems. This article walks you through the process of how to use the sheet.
Since the cheat sheet is designed for beginner data scientists and analysts, we will make some simplified assumptions when talking about the algorithms.
The algorithms recommended here result from compiled feedback and tips from several data scientists and machine learning experts and developers. There are several issues on which we have not reached an agreement and for these issues we try to highlight the commonality and reconcile the difference.
Additional algorithms will be added in later as our library grows to encompass a more complete set of available methods.
How to use the cheat sheet
Read the path and algorithm labels on the chart as "If <path label> then use <algorithm>." For example:- If you want to perform dimension reduction then use principal component analysis.
- If you need a numeric prediction quickly, use decision trees or logistic regression.
- If you need a hierarchical result, use hierarchical clustering.
Types of machine learning algorithms
This section provides an overview of the most popular types of machine learning. If you’re familiar with these categories and want to move on to discussing specific algorithms, you can skip this section and go to “When to use specific algorithms” below.Supervised learning
Supervised learning algorithms make predictions based on a set of examples. For example, historical sales can be used to estimate the future prices. With supervised learning, you have an input variable that consists of labeled training data and a desired output variable. You use an algorithm to analyze the training data to learn the function that maps the input to the output. This inferred function maps new, unknown examples by generalizing from the training data to anticipate results in unseen situations.- Classification: When the data are being used to predict a categorical variable, supervised learning is also called classification. This is the case when assigning a label or indicator, either dog or cat to an image. When there are only two labels, this is called binary classification. When there are more than two categories, the problems are called multi-class classification.
- Regression: When predicting continuous values, the problems become a regression problem.
- Forecasting: This is the process of making predictions about the future based on the past and present data. It is most commonly used to analyze trends. A common example might be estimation of the next year sales based on the sales of the current year and previous years.
Semi-supervised learning
The challenge with supervised learning is that labeling data can be expensive and time consuming. If labels are limited, you can use unlabeled examples to enhance supervised learning. Because the machine is not fully supervised in this case, we say the machine is semi-supervised. With semi-supervised learning, you use unlabeled examples with a small amount of labeled data to improve the learning accuracy.Unsupervised learning
When performing unsupervised learning, the machine is presented with totally unlabeled data. It is asked to discover the intrinsic patterns that underlies the data, such as a clustering structure, a low-dimensional manifold, or a sparse tree and graph.- Clustering: Grouping a set of data examples so that examples in one group (or one cluster) are more similar (according to some criteria) than those in other groups. This is often used to segment the whole dataset into several groups. Analysis can be performed in each group to help users to find intrinsic patterns.
- Dimension reduction: Reducing the number of variables under consideration. In many applications, the raw data have very high dimensional features and some features are redundant or irrelevant to the task. Reducing the dimensionality helps to find the true, latent relationship.
Reinforcement learning
Reinforcement learning analyzes and optimizes the behavior of an agent based on the feedback from the environment. Machines try different scenarios to discover which actions yield the greatest reward, rather than being told which actions to take. Trial-and-error and delayed reward distinguishes reinforcement learning from other techniques.Considerations when choosing an algorithm
When choosing an algorithm, always take these aspects into account: accuracy, training time and ease of use. Many users put the accuracy first, while beginners tend to focus on algorithms they know best.When presented with a dataset, the first thing to consider is how to obtain results, no matter what those results might look like. Beginners tend to choose algorithms that are easy to implement and can obtain results quickly. This works fine, as long as it is just the first step in the process. Once you obtain some results and become familiar with the data, you may spend more time using more sophisticated algorithms to strengthen your understanding of the data, hence further improving the results.
Even in this stage, the best algorithms might not be the methods that have achieved the highest reported accuracy, as an algorithm usually requires careful tuning and extensive training to obtain its best achievable performance.
When to use specific algorithms
Looking more closely at individual algorithms can help you understand what they provide and how they are used. These descriptions provide more details and give additional tips for when to use specific algorithms, in alignment with the cheat sheet.Linear regression and Logistic regression
-
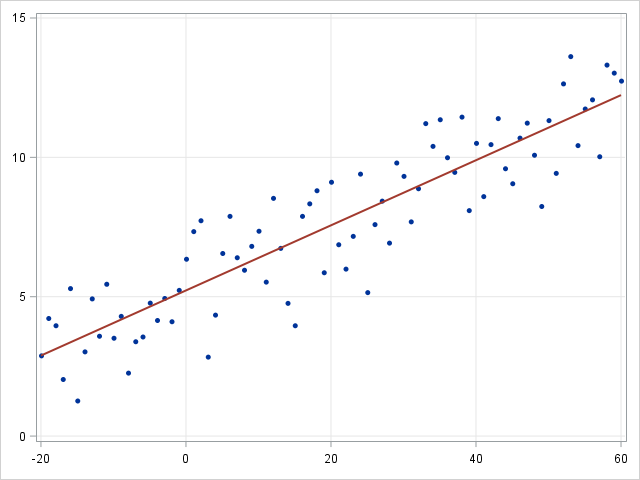
- Linear regression
-
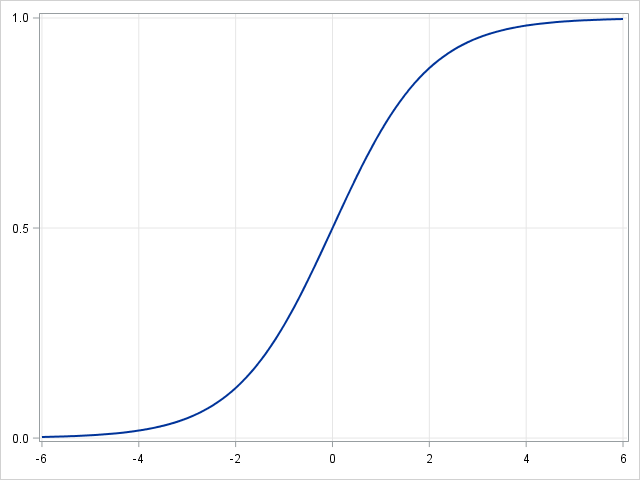
- Logistic regression
and one or more predictors
If the dependent variable is not continuous but categorical, linear regression can be transformed to logistic regression using a logit link function. Logistic regression is a simple, fast yet powerful classification algorithm. Here we discuss the binary case where the dependent variable
only takes binary values
In logistic regression we use a different hypothesis class to try to predict the probability that a given example belongs to the "1" class versus the probability that it belongs to the "-1" class. Specifically, we will try to learn a function of the form:
and
-
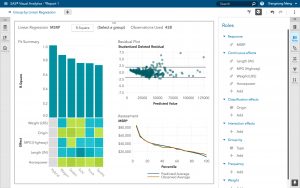
- Group By Linear Regression
-
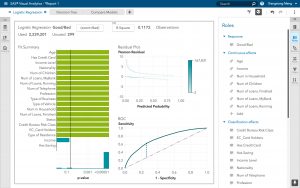
- Logistic Regression in SAS Visual Analytics
Linear SVM and kernel SVM
Kernel tricks are used to map a non-linearly separable functions into a higher dimension linearly separable function. A support vector machine (SVM) training algorithm finds the classifier represented by the normal vectorand bias
Kernel tricks are used to map a non-linearly separable functions into a higher dimension linearly separable function.
When most dependent variables are numeric, logistic regression and SVM should be the first try for classification. These models are easy to implement, their parameters easy to tune, and the performances are also pretty good. So these models are appropriate for beginners.
Trees and ensemble trees
A decision tree for prediction model
Neural networks and deep learning
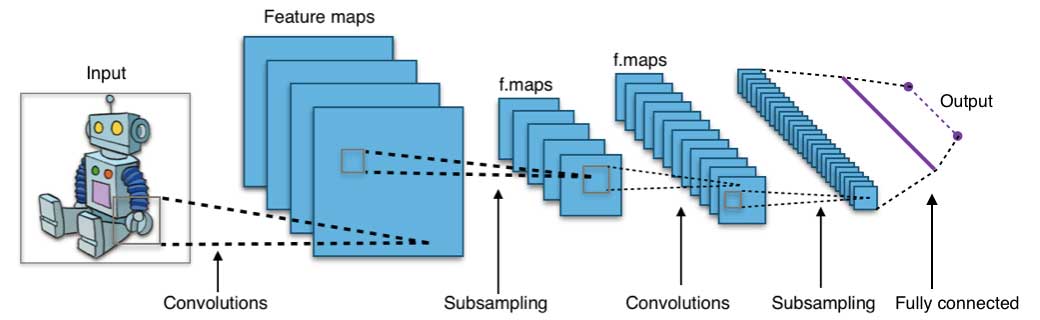
A convolution neural network architecture (image source: wikipedia creative commons)
In recent years, new and improved training techniques such as unsupervised pre-training and layer-wise greedy training have led to a resurgence of interest in neural networks. Increasingly powerful computational capabilities, such as graphical processing unit (GPU) and massively parallel processing (MPP), have also spurred the revived adoption of neural networks. The resurgent research in neural networks has given rise to the invention of models with thousands of layers.
A neural network in SAS Visual Analytics
A neural network consists of three parts: input layer, hidden layers and output layer. The training samples define the input and output layers. When the output layer is a categorical variable, then the neural network is a way to address classification problems. When the output layer is a continuous variable, then the network can be used to do regression. When the output layer is the same as the input layer, the network can be used to extract intrinsic features. The number of hidden layers defines the model complexity and modeling capacity.
Deep Learning: What it is and why it matters
k-means/k-modes, GMM (Gaussian mixture model) clustering
-
- K Means Clustering
-
- Gaussian Mixture Model
DBSCAN
A DBSCAN illustration (image source: Wikipedia)
Hierarchical clustering
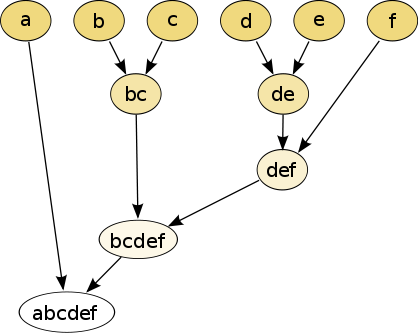
Hierarchical partitions can be visualized using a tree structure (a dendrogram). It does not need the number of clusters as an input and the partitions can be viewed at different levels of granularities (i.e., can refine/coarsen clusters) using different K.
PCA, SVD and LDA
We generally do not want to feed a large number of features directly into a machine learning algorithm since some features may be irrelevant or the “intrinsic” dimensionality may be smaller than the number of features. Principal component analysis (PCA), singular value decomposition (SVD), and latent Dirichlet allocation (LDA) all can be used to perform dimension reduction.PCA is an unsupervised clustering method which maps the original data space into a lower dimensional space while preserving as much information as possible. The PCA basically finds a subspace that most preserves the data variance, with the subspace defined by the dominant eigenvectors of the data’s covariance matrix.
The SVD is related to PCA in the sense that SVD of the centered data matrix (features versus samples) provides the dominant left singular vectors that define the same subspace as found by PCA. However, SVD is a more versatile technique as it can also do things that PCA may not do. For example, the SVD of a user-versus-movie matrix is able to extract the user profiles and movie profiles which can be used in a recommendation system. In addition, SVD is also widely used as a topic modeling tool, known as latent semantic analysis, in natural language processing (NLP).
A related technique in NLP is latent Dirichlet allocation (LDA). LDA is probabilistic topic model and it decomposes documents into topics in a similar way as a Gaussian mixture model (GMM) decomposes continuous data into Gaussian densities. Differently from the GMM, an LDA models discrete data (words in documents) and it constrains that the topics are a priori distributed according to a Dirichlet distribution.
Conclusions
This is the work flow which is easy to follow. The takeaway messages when trying to solve a new problem are:- Define the problem. What problems do you want to solve?
- Start simple. Be familiar with the data and the baseline results.
- Then try something more complicated.
Thursday, May 24, 2018
Wednesday, May 23, 2018
Road Map for Choosing Between Statistical Modeling and Machine Learning
http://www.fharrell.com/post/stat-ml/
ML is taken to mean an algorithmic approach that does not use traditional identified statistical parameters, and for which a preconceived structure is not imposed on the relationships between predictors and outcomes. ML usually does not attempt to isolate the effect of any single variable. ML includes random forests, recursive partitioning (CART), bagging, boosting, support vector machines, neural networks, and deep learning. ML does not model the data generating process but rather attempts to learn from the dataset at hand. ML is more a part of computer science than it is part of statistics. Perhaps the simplest way to distinguish ML form SMs is that SMs (at least in the regression subset of SM) favor additivity of predictor effects while ML usually does not give additivity of effects any special emphasis.
ML and AI have had their greatest successes in high signal:noise situations, e.g., visual and sound recognition, language translation, and playing games with concrete rules. What distinguishes these is quick feedback while training, and availability of the answer. Things are different in the low signal:noise world of medical diagnosis and human outcomes. A great use of ML is in pattern recognition to mimic radiologists’ expert image interpretations. For estimating the probability of a positive biopsy given symptoms, signs, risk factors, and demographics, not so much.
There are many published comparisons of predictive performance of SM and ML. In many of the comparisons, only naive regression methods are used (e.g., everything is assumed to operate linearly), so the SM comparator is nothing but a straw man. And not surprisingly, ML wins. The reverse also happens, where the ML comparator algorithm uses poorly-chosen default parameters or the particular ML methods chosen for comparison are out of date. As a side note, when the SM method is just a straw man, the outcry from the statistical community is relatively muted compared with the outcry from ML advocates when the “latest and greatest” ML algorithm was not used in the comparison with SMs. ML seems to require more tweaking than SMs. But SMs often require a time-consuming data reduction step (unsupervised learning) when the number of candidate predictors is very large and penalization (lasso or otherwise) is not desired.
Note that there are ML algorithms that provide superior predictive discrimination but that pay insufficient attention to calibration (absolute accuracy).
Because SMs favor additivity as a default assumption, when additive effects dominate, SM requires far lower sample sizes (typically 20 events per candidate predictor) than ML, which typically requires 200 events per candidate predictor. Thus ML can sometimes create a demand for “big data” when small-moderate sized datasets will do. I sometimes dislike ML solutions for particular medical problems because of ML’s lack of assumptions. But SMs are not very good at reliably finding non-pre-specified interactions; SM typically requires interactions to be pre-specified. On the other hand, AHRQ-sponsored research I did on large medical outcomes datasets in the 1990s with the amazing University of Nevada Reno physician-statistician Phil Goodman, whom we lost at an all-too-early age, demonstrated that important non-additive effects are rare when predicting patient mortality. As a result, neural networks were no better than logistic regression in terms of predictive discrimination in these datasets.
There are many current users of ML algorithms who falsely believe that one can make reliable predictions from complex datasets with a small number of observations. Statisticians are pretty good at knowing the limitations caused by the effective sample size, and to stop short of trying to incorporate model complexity that is not supported by the information content of the sample.
Here are some rough guidelines that attempt to help researchers choose between the two approaches, for a prediction problem1.
A statistical model may be the better choice if
The two fields may also be defined by how their practitioners spend their time. Someone engaged in ML will mainly spend her time choosing algorithms, writing code, specifying tuning parameters, waiting for the algorithm to run on a computer or cluster, and analyzing the accuracy of the resulting predictions. Someone engaged mainly in SMs will tend to spend time choosing a statistical model family, specifying the model, checking goodness of fit, analyzing accuracy of predictions, and interpreting estimated effects.
See this for more twitter discussions.
It is often good to let the data speak. But you must be comfortable in
assuming that the data are speaking rationally. Data can fool you.
Whether using statistical modeling or machine learning, work with a methodologist who knows what she is doing, and don't begin an analysis without ample subject matter input.
Data analysis methods may be described by their areas of
applications, but for this article I’m using definitions that are
strictly methods-oriented. A statistical model (SM) is a data model
that incorporates probabilities for the data generating mechanism and
has identified unknown parameters that are usually interpretable and of
special interest, e.g., effects of predictor variables and
distributional parameters about the outcome variable. The most commonly
used SMs are regression models, which potentially allow for a
separation of the effects of competing predictor variables. SMs include
ordinary regression, Bayesian regression, semiparametric models,
generalized additive models, longitudinal models, time-to-event models,
penalized regression, and others. Penalized regression includes ridge
regression, lasso, and elastic net. Contrary to what some machine
learning (ML) researchers believe, SMs easily allow for complexity
(nonlinearity and second-order interactions) and an unlimited number of
candidate features (if penalized maximum likelihood estimation or
Bayesian models with sharp skeptical priors are used). It is especially
easy, using regression splines, to allow every continuous predictor to
have a smooth nonlinear effect.Whether using statistical modeling or machine learning, work with a methodologist who knows what she is doing, and don't begin an analysis without ample subject matter input.
ML is taken to mean an algorithmic approach that does not use traditional identified statistical parameters, and for which a preconceived structure is not imposed on the relationships between predictors and outcomes. ML usually does not attempt to isolate the effect of any single variable. ML includes random forests, recursive partitioning (CART), bagging, boosting, support vector machines, neural networks, and deep learning. ML does not model the data generating process but rather attempts to learn from the dataset at hand. ML is more a part of computer science than it is part of statistics. Perhaps the simplest way to distinguish ML form SMs is that SMs (at least in the regression subset of SM) favor additivity of predictor effects while ML usually does not give additivity of effects any special emphasis.
ML and AI have had their greatest successes in high signal:noise situations, e.g., visual and sound recognition, language translation, and playing games with concrete rules. What distinguishes these is quick feedback while training, and availability of the answer. Things are different in the low signal:noise world of medical diagnosis and human outcomes. A great use of ML is in pattern recognition to mimic radiologists’ expert image interpretations. For estimating the probability of a positive biopsy given symptoms, signs, risk factors, and demographics, not so much.
There are many published comparisons of predictive performance of SM and ML. In many of the comparisons, only naive regression methods are used (e.g., everything is assumed to operate linearly), so the SM comparator is nothing but a straw man. And not surprisingly, ML wins. The reverse also happens, where the ML comparator algorithm uses poorly-chosen default parameters or the particular ML methods chosen for comparison are out of date. As a side note, when the SM method is just a straw man, the outcry from the statistical community is relatively muted compared with the outcry from ML advocates when the “latest and greatest” ML algorithm was not used in the comparison with SMs. ML seems to require more tweaking than SMs. But SMs often require a time-consuming data reduction step (unsupervised learning) when the number of candidate predictors is very large and penalization (lasso or otherwise) is not desired.
Note that there are ML algorithms that provide superior predictive discrimination but that pay insufficient attention to calibration (absolute accuracy).
Because SMs favor additivity as a default assumption, when additive effects dominate, SM requires far lower sample sizes (typically 20 events per candidate predictor) than ML, which typically requires 200 events per candidate predictor. Thus ML can sometimes create a demand for “big data” when small-moderate sized datasets will do. I sometimes dislike ML solutions for particular medical problems because of ML’s lack of assumptions. But SMs are not very good at reliably finding non-pre-specified interactions; SM typically requires interactions to be pre-specified. On the other hand, AHRQ-sponsored research I did on large medical outcomes datasets in the 1990s with the amazing University of Nevada Reno physician-statistician Phil Goodman, whom we lost at an all-too-early age, demonstrated that important non-additive effects are rare when predicting patient mortality. As a result, neural networks were no better than logistic regression in terms of predictive discrimination in these datasets.
There are many current users of ML algorithms who falsely believe that one can make reliable predictions from complex datasets with a small number of observations. Statisticians are pretty good at knowing the limitations caused by the effective sample size, and to stop short of trying to incorporate model complexity that is not supported by the information content of the sample.
Here are some rough guidelines that attempt to help researchers choose between the two approaches, for a prediction problem1.
A statistical model may be the better choice if
- Uncertainty is inherent and the signal:noise ratio is not large—even with identical twins, one twin may get colon cancer and the other not; one should model tendencies instead of doing classification when there is randomness in the outcome
- One doesn’t have perfect training data, e.g., cannot repeatedly test one subject and have outcomes assessed without error
- One wants to isolate effects of a small number of variables
- Uncertainty in an overall prediction or the effect of a predictor is sought
- Additivity is the dominant way that predictors affect the outcome, or interactions are relatively small in number and can be pre-specified
- The sample size isn’t huge
- One wants to isolate (with a predominantly additive effect) the effects of “special” variables such as treatment or a risk factor
- One wants the entire model to be interpretable
- The signal:noise ratio is large and the outcome being predicted
doesn’t have a strong component of randomness; e.g., in visual pattern
recognition an object must be an
Eor not anE - The learning algorithm can be trained on an unlimited number of exact replications (e.g., 1000 repetitions of each letter in the alphabet or of a certain word to be translated to German)
- Overall prediction is the goal, without being able to succinctly describe the impact of any one variable (e.g., treatment)
- One is not very interested in estimating uncertainty in forecasts or in effects of selected predictors
- Non-additivity is expected to be strong and can’t be isolated to a
few pre-specified variables (e.g., in visual pattern recognition the
letter
Lmust have both a dominating vertical component and a dominating horizontal component and these two must intersect at their endpoints) - The sample size is huge
- One does not need to isolate the effect of a special variable such as treatment
- One does not care that the model is a “black box”
Editorial Comment
Some readers have commented on twitter that I’ve created a false dichotomy of SMs vs. ML. There is some truth in this claim. The motivations for my approach to the presentation are- to clarify that regression models are not ML2
- to sharpen the discussion by having a somewhat concrete definition of ML as a method without “specialness” of the parameters, that does not make many assumptions about the structure of predictors in relation to the outcome being predicted, and that does not explicitly incorporate uncertainty (e.g., probability distributions) into the analysis
- to recognize that the bulk of machine learning being done today, especially in biomedical research, seems to be completely uninformed by statistical principles (much to its detriment IMHO), even to the point of many ML users not properly understanding predictive accuracy. It is impossible to have good predictions that address the problem at hand without a thorough understanding of measures of predictive accuracy when choosing the measure to optimize.
The two fields may also be defined by how their practitioners spend their time. Someone engaged in ML will mainly spend her time choosing algorithms, writing code, specifying tuning parameters, waiting for the algorithm to run on a computer or cluster, and analyzing the accuracy of the resulting predictions. Someone engaged mainly in SMs will tend to spend time choosing a statistical model family, specifying the model, checking goodness of fit, analyzing accuracy of predictions, and interpreting estimated effects.
See this for more twitter discussions.
Further Reading
- Follow-up Article by Drew Levy: Navigating Statistical Modeling and Machine Learning
- Statistical Modeling: The Two Cultures by Leo Breiman
Note: I very much disagree with Breiman’s view that data models are not important. How would he handle truncated/censored data for example? I do believe that data models need to be flexible. This is facilitated by Bayesian modeling. - Big Data and Machine Learning in Health Care by AL Beam and IS Kohane
- Harvard Business Review article Why You’re Not Getting Value From Your Data Science, about regression vs. machine learning in business applications
- What’s the Difference Between Machine Learning, Statistics, and Data Mining?
Footnotes
- Note that as described here, it is not appropriate to cast a prediction problem as a classification problem except in special circumstances that usually entail instant visual or sound pattern recognition requirements in a high signal:noise situation where the utility/cost/loss function cannot be specified. ML practitioners frequently misunderstand this, leading them to use improper accuracy scoring rules. ^
- There is an intersection of ML and regression in neural networks. See this article for more. ^
Subscribe to:
Posts (Atom)